

Welcome to Ground Truth, OmniGeo’s publication on the intersection of geospatial AI and physical risk — for the people building in Earth observation and the underwriters, asset owners, and risk teams who have to trust them.
On December 30, 2021, the Marshall Fire destroyed more than 1,000 homes in Boulder County in a matter of hours. Not days. Hours. For many Coloradans, the Marshall Fire shattered a deeply held assumption about wildfire risk: that wildfire is primarily a forest problem. It wasn’t.
The Marshall Fire was largely a grass-fueled, wind-driven urban conflagration. Once structures began igniting, homes themselves became fuel. Embers traveled miles. Entire neighborhoods burned despite being far from dense forests. Yet nearly five years later, many of the public wildfire risk maps used by homeowners, policymakers, insurers, and planners still struggle to represent this reality.
A recent criticism of the Colorado State Forest Service’s Wildfire Risk Viewer highlighted exactly this concern. The map correctly identifies wildland fire intensity across the landscape but appears less capable of representing how risk evolves once fire enters the built environment. The criticism may be blunt. The underlying issue is not. It’s one of the most important challenges in wildfire science today.
The Problem Isn't Forest Fire Modeling
To be fair, the Colorado Wildfire Risk Viewer was never designed to be a parcel-level urban fire model. It is a valuable public resource that helps homeowners understand: fire intensity potential, burn probability, historical fire occurrence, broad landscape-level hazards.
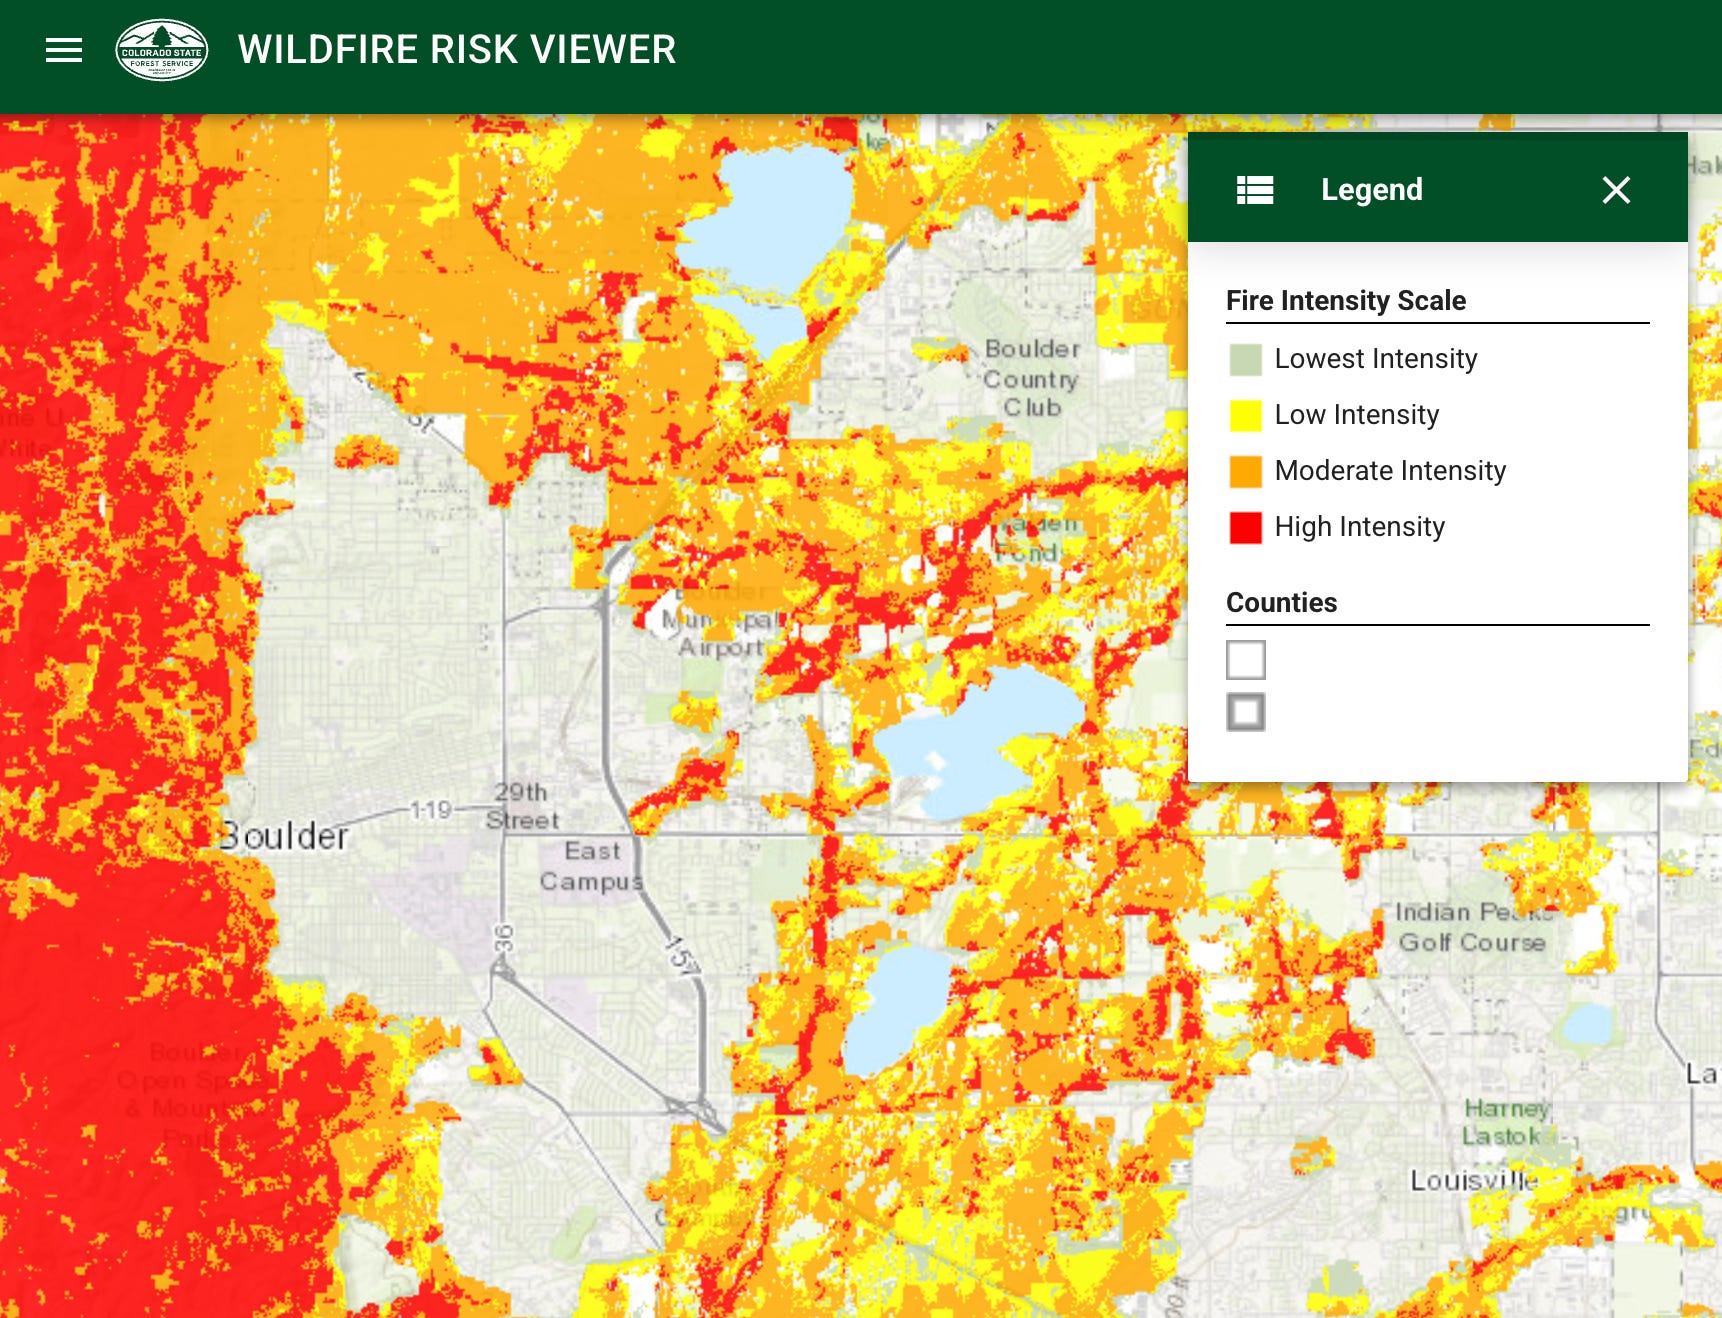
Those are important inputs. But they are not sufficient for understanding what happened in Louisville, Superior, Lahaina, Paradise, or increasingly many communities across the American West. Because once wildfire reaches neighborhoods, the risk equation changes. The fuels are no longer just: trees, shrubs, grasslands. The fuels become: roofs, fences, decks, sheds, vehicles, landscaping, building-to-building spacing, construction materials. In other words:
The built environment becomes the fuel model. And most wildfire risk maps still have limited visibility into it.
The Missing Layer: What Things Are Made Of
Modern wildfire maps are incredibly sophisticated at characterizing vegetation.
We have:
Fuel models
Canopy height models
Vegetation density estimates
Drought indicators
Weather forecasts
Fire spread simulations
What we often lack is an equally detailed understanding of the structures those fires threaten. For example: two homes may look identical from a traditional risk model.
But one may have:
Class A asphalt shingles
Stucco siding
Metal fencing
Five feet of defensible space
While the other has:
Wood shake roofing
Combustible fencing
Dense ornamental vegetation
Attached wooden structures
From a wildfire perspective, these are not the same risk. Yet many existing systems cannot distinguish them at scale.
Wildfire Risk Has Become a Materials Science Problem
Historically, wildfire risk assessment focused on: “How likely is fire to arrive?” Today, insurers, utilities, and communities increasingly need to answer: “What happens after it arrives?” That question depends heavily on materials. Not just geometry. Not just location. Not just vegetation. Materials. The difference between: asphalt and wood shake roofs, green vegetation and cured vegetation, metal fencing and cedar fencing, moist fuels and dry fuels often determines whether a structure survives or is lost. The challenge is that most geospatial systems still primarily understand the world through shape and appearance. Wildfire behavior increasingly requires understanding the world through composition.
We Need Fuel Maps for Communities, Not Just Forests
Imagine if every parcel had an evolving digital fuel profile. Not simply: high risk, medium risk, low risk but: roof material, roof condition, vegetation type, vegetation moisture, defensible space quality, fuel continuity, building spacing, changes through time. Updated continuously from Earth observation systems. Now imagine combining those data with: weather forecasts, topography, fire behavior models, historical losses. That begins to look less like a traditional wildfire map and more like a living model of community resilience.
The Technology Is Finally Catching Up
For years, this vision was impossible. The imagery wasn’t available. The computing power wasn’t available. The AI wasn’t available. Today, all three are converging. A new generation of Earth observation systems, geospatial AI, spectral analysis techniques, and large Earth models are beginning to move beyond identifying objects toward identifying materials and conditions.
Instead of merely recognizing a roof. They can begin asking: What is the roof made of? How has it changed? What condition is it in? What surrounds it? How combustible are those surroundings? That shift, from seeing shapes to understanding materials, may prove as important for wildfire risk as weather forecasting was for hurricane prediction. The broader Earth observation community is increasingly moving in this direction, with new foundation-model approaches focused on generating richer representations of the physical world from satellite imagery and multi-modal geospatial data.
The Next Marshall Fire Is Already Being Modeled Just Not Completely.
The uncomfortable reality is that many current wildfire maps are still optimized for the fires of the past. The fires we’re seeing now increasingly involve: extreme winds, human-built fuel networks, structure-to-structure ignition, rapid urban fire spread.
These events sit at the intersection of ecology, meteorology, engineering, and materials science. No single map layer can capture them. No single model can capture them. And no single agency should be expected to solve the problem alone. But if we learned anything from Marshall Fire, it should be this: Wildfire risk doesn’t end where the forest ends.
That’s where a different kind of risk begins. The future of wildfire intelligence won’t come from better vegetation maps alone. It will come from understanding the complete fuel landscape, from forests to fences, from shrubs to shingles, from ecosystems to neighborhoods. Only then will we start building risk models that reflect how modern wildfires actually behave. And only then will we stop being surprised by disasters that, in hindsight, were hiding in plain sight.
The measurement layer behind Ground Truth
OmniGeo’s first product, OmniFire, closes the earth measurement gap for insurers in wildfire-prone areas. OmniFire turns standard imagery into parcel-level measurements of what a property is actually made of, including roof material, defensible space, and fuel moisture. It’s vulnerability measured at scale and it’s live today. If you underwrite, price, or manage wildfire risk, visit www.omnigeo.ai/omnifire to learn more.