

Wildfire risk has a persistent measurement problem. We can estimate where a fire may go, how intensely it may burn, and which buildings sit in its path. We still struggle with a more basic question: Why do some buildings survive when nearby buildings do not?
This gap sits inside the damage function, sometimes called the vulnerability function: the relationship that translates a level of hazard into an expected damage ratio and, ultimately, financial loss. Insurers model this relationship today, but they rarely measure the underlying vulnerability of each asset with enough detail or frequency to make it truly property-specific. Without that layer, it is difficult to calculate financial loss accurately. A model may know that two homes face the same fire intensity, yet still lack the evidence needed to explain why one is likely to survive and the other is likely to be destroyed.
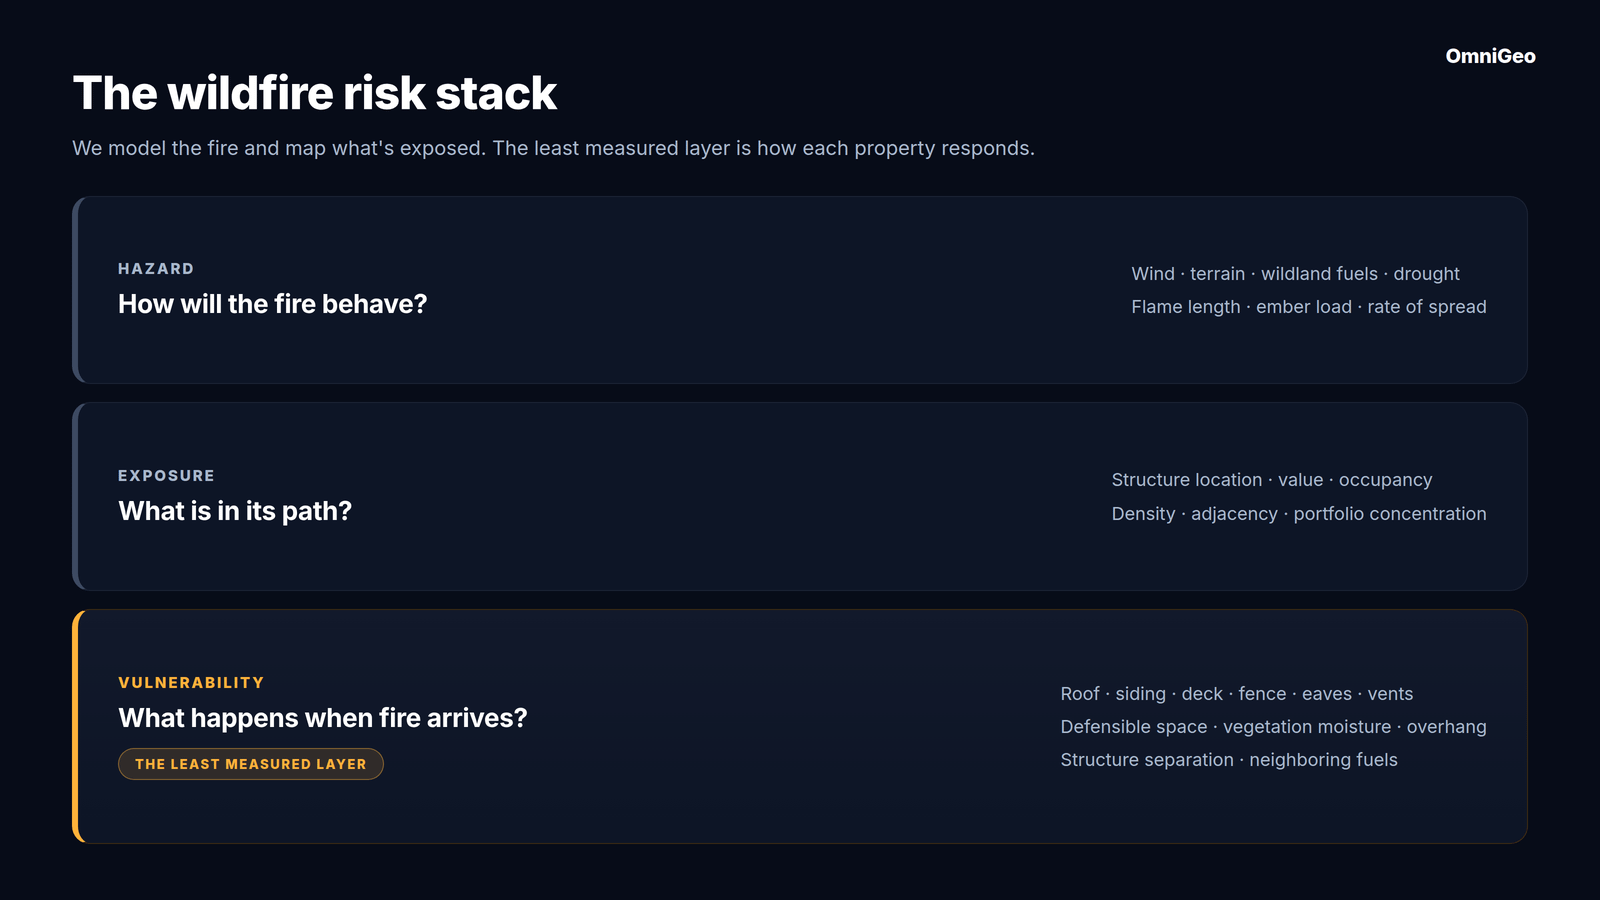
The wildfire industry has invested decades in understanding the fire itself. We can model fuels, weather, topography, ignition probability, flame length, rate of spread, and ember transport. These systems are not perfect, but the hazard layer has become sophisticated.
We have also become good at mapping exposure. We know where structures are, how much they are worth, and how they cluster across a community or portfolio.
The least developed part of the stack is vulnerability: the physical characteristics that determine how a building and its immediate surroundings respond when fire arrives.
This layer includes roof, siding, deck, fence, eave, vent, and window materials. It includes vegetation density, vegetation health and moisture, canopy overhang, and the condition of defensible space in the first five feet and beyond. It also includes the distance and arrangement of nearby buildings, because one burning structure can become the fuel source for the next.
These are not secondary details. They are the difference between exposure to fire and destruction by fire.
Hazard, exposure, and vulnerability answer different questions
A useful wildfire risk stack has three layers.
Hazard: How likely is fire to reach this location, and with what intensity?
Exposure: Which buildings, people, and financial values are in its path?
Vulnerability: Given that exposure, how likely is each structure to ignite, sustain damage, or spread fire to its neighbors?
The first two layers can often be modeled from regional data. Vulnerability is different. Two homes can share the same slope, wind, and wildland fuel exposure but respond very differently because one has a combustible roof and wood fence while the other has a Class A roof, enclosed eaves, ember-resistant vents, and a clear Zone 0.
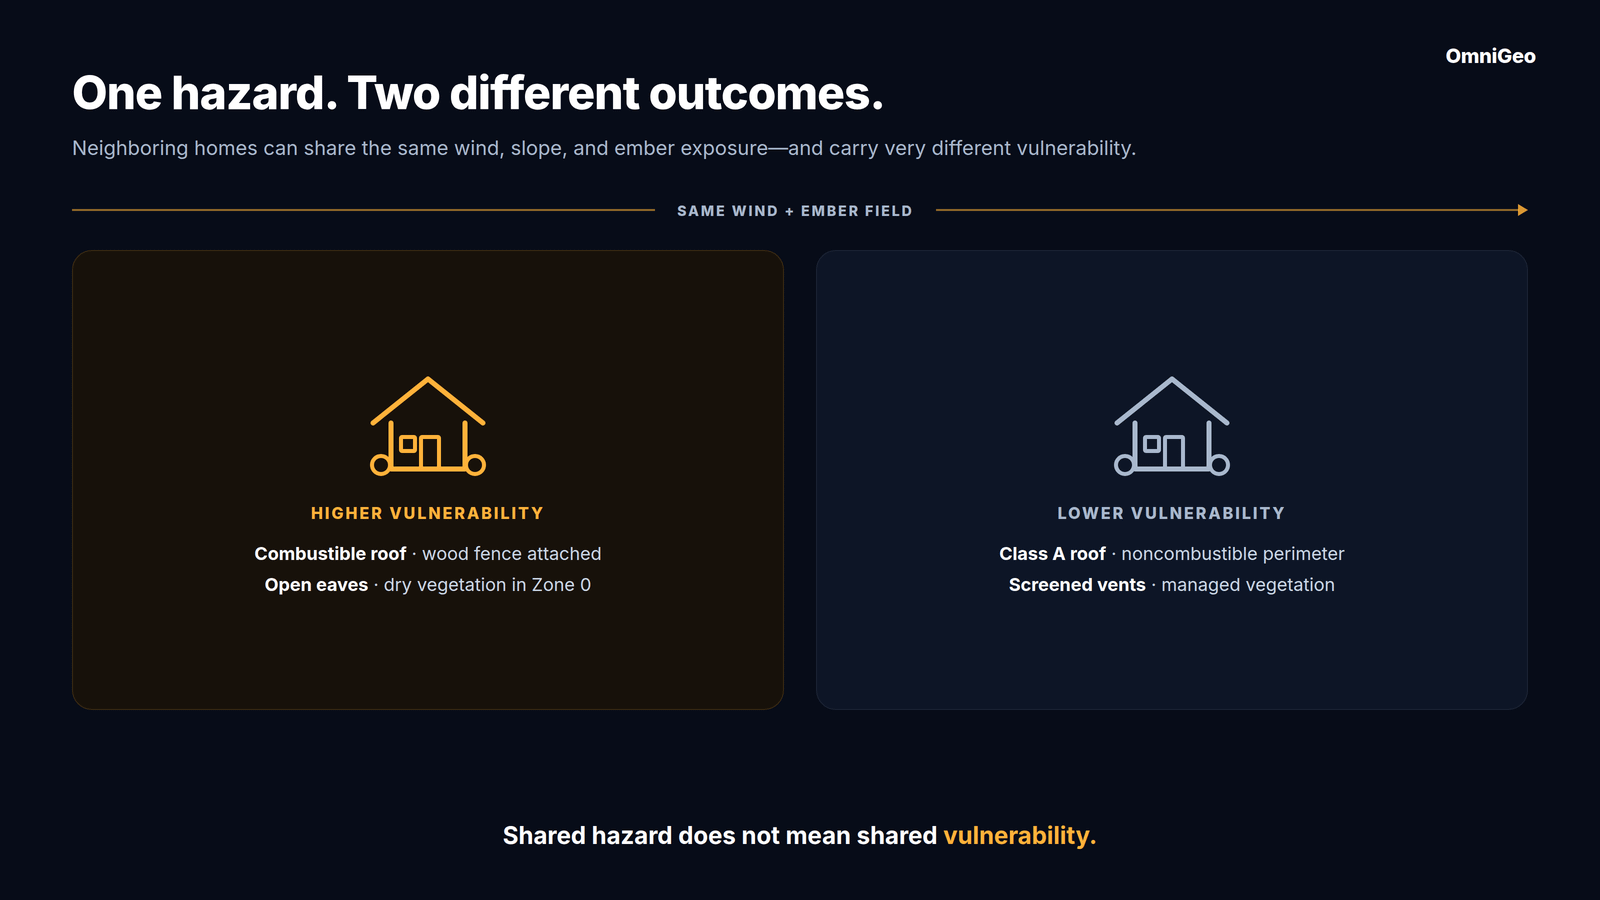
An area-level hazard score cannot resolve that difference. Nor can a building footprint or replacement value. The model needs to know what the property is made of and what condition it is in now.
A new study sizes up vulnerability
A July 2026 Science Advances study from UC Irvine provides a useful framework for this problem. The researchers analyzed more than 100,000 CAL FIRE damage inspection records from 22 fires between 2013 and 2024. They combined environmental conditions, weather, human footprint, and building characteristics to explain whether structures were damaged.
The team created a Composite Building Flammability Rating, or CBFR. It combined ten building attributes, including fence material, exterior siding, building age, roof material, eave type, deck or porch material, vent screens, and windowpanes. Each attribute received a flammability rating. The researchers then calibrated the weights against observed wildfire damage.
The result matters. In the study’s primary validation, the comprehensive model reached 88% accuracy. Accuracy fell to 82.9% when CBFR was removed, and to 74.5% when both CBFR and weather were removed. Under a more demanding spatial grid test, overall performance was lower, and the improvement from CBFR was smaller. That is an important limitation. It is also a reminder that no single result should be treated as universal.
Still, the direction was clear. Building flammability was the most important predictor in the comprehensive model. Within CBFR, fence material carried the largest weight at 16%, followed by exterior siding at 15%, building year at 14%, roof material at 13%, and eave type at 10%. The authors found that wildfire damage followed a predictable interaction among structural vulnerability, atmospheric dryness, wind, and fuel exposure.
The finding is encouraging because many vulnerability factors can be changed. A homeowner cannot change regional fire weather. They can replace a wood fence, harden a roof, screen vents, enclose eaves, remove combustible material from Zone 0, or improve vegetation management.
The inspection data reveals the measurement problem
The UC Irvine study could build CBFR because California has something no other state has: a statewide wildfire damage-assessment system with structure-level ground truth. Through CAL FIRE’s Damage Inspection Specialist program, inspectors visit affected properties after fires and record whether structures were destroyed, damaged, or survived, as well as detailed information on materials and building components. Those DINS records provided the ground truth needed to link structural characteristics to real world outcomes.
No other state routinely sends inspectors to create a comparable statewide, structure-level post-fire database. That makes California uniquely valuable for validation. OmniGeo compared its spectral-intelligence classifications of destroyed and surviving homes with the DINS ground truth and achieved greater than 97% accuracy, without relying on conventional vision models. I will explain that validation work and what it reveals about measuring wildfire outcomes from imagery in a separate post.
That is excellent data for retrospective research. It is not an operational measurement system for millions of properties before a fire.
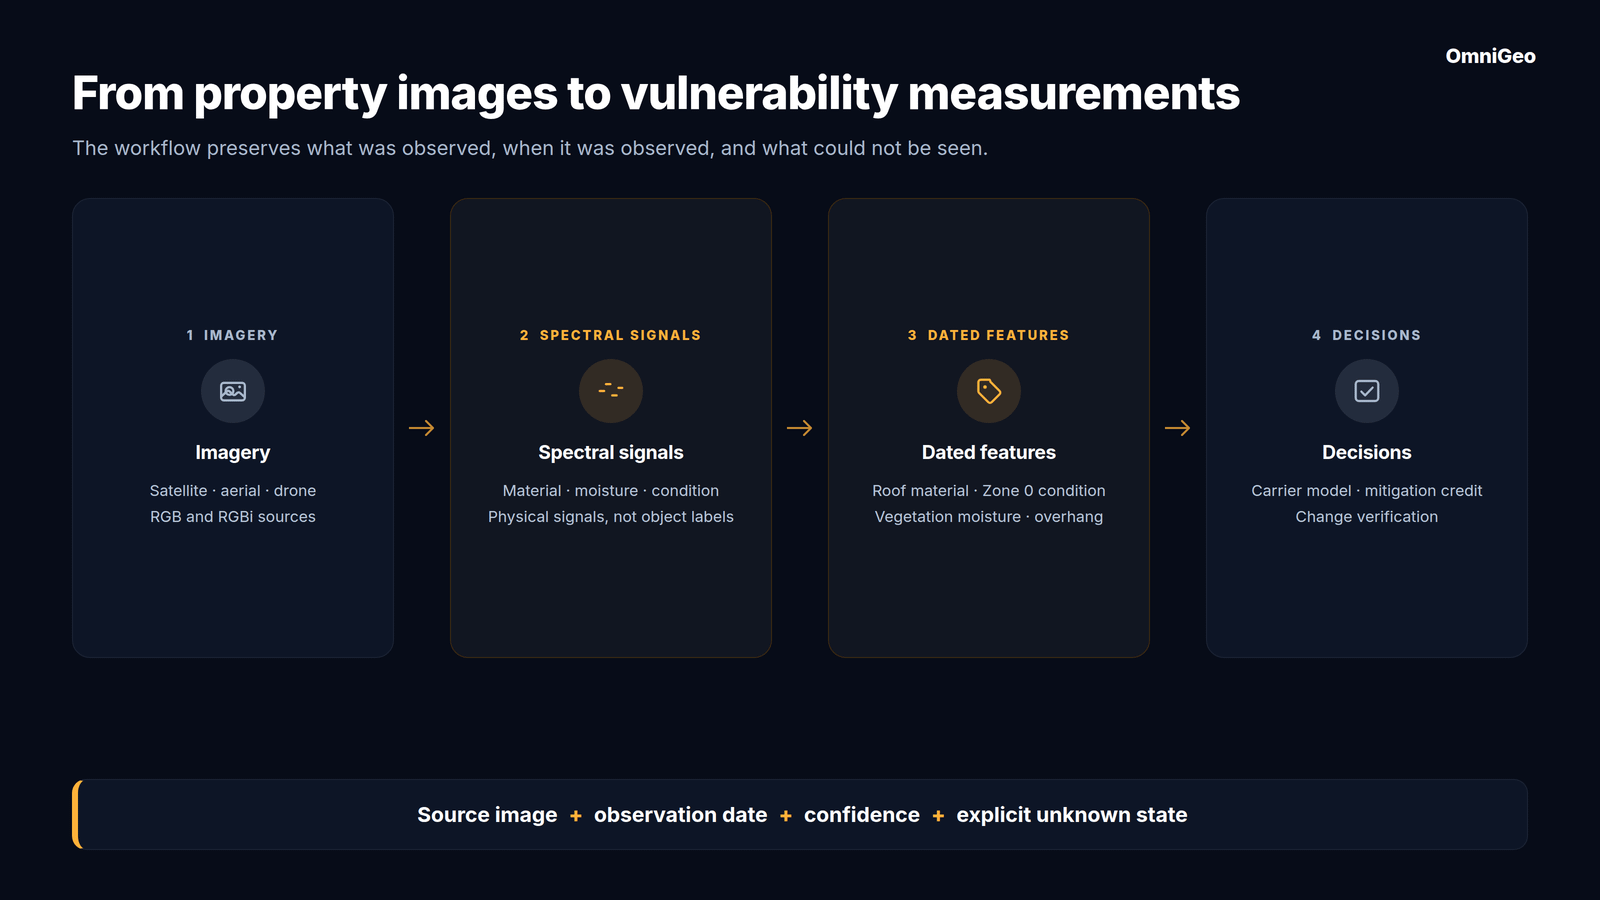
A carrier needs current information across an entire portfolio, not only a sample of inspected homes. It needs the same feature definitions from property to property. It needs an observation date, a confidence level, and a way to distinguish “not present” from “not visible.” It also needs to refresh the data after a roof replacement, vegetation clearing, drought, regrowth, or new construction.
Materials can look alike. A metal roof and a gray composite roof can appear similar in standard imagery. Painted wood and fiber cement siding can share a color and texture.
Some conditions are biological. Vegetation moisture and health are physical states, not object labels. Green-looking vegetation can still be stressed and combustible.
Distance changes meaning by zone. Vegetation touching a wall is not equivalent to vegetation 30 feet away. A useful system must locate fuels relative to the structure and defensible-space zones.
The property changes. Mitigation completed last month can make an older observation wrong. Seasonal drying can change vegetation condition even when the plants remain in the same place.
Visibility is uneven. Roofs are visible from above. Siding, decks, vents, and eaves often require oblique imagery or another source. A system must state what it can and cannot see.
This is why vulnerability cannot be solved by adding another regional score. It requires a repeatable measurement layer that can read materials, conditions, and change at the property level.
From images of properties to measurements of properties
Conventional computer vision is good at recognizing objects: roof, tree, deck, fence. Wildfire vulnerability requires a harder answer: What is that object made of, how combustible is it, how much moisture does it contain, and how has it changed?
OmniGeo built OmniFire for this layer. Its spectral intelligence system derives material and condition information from standard RGB and RGBi imagery across satellite, aerial, and drone sources. The system is designed to recover signals associated with material composition, vegetation moisture, and physical condition, then return parcel-level features with source and observation provenance.
Today, those features include roof material, vegetation moisture, vegetation density, tree overhang, and defensible space by zone. With suitable oblique imagery, the system can also assess siding and deck materials. The point is not that every vulnerability factor can be observed from every image. The point is to measure the observable factors, identify the ones that are not, and update the record as better or newer imagery becomes available.
This creates a path from the science to insurance operations. A carrier can connect feature-level observations to its claims, test how they interact with hazard and exposure, apply its own underwriting rules, and verify whether mitigation changed the property. A reinsurer can examine the vulnerability composition of a portfolio rather than adding an assumption when the underlying building data is missing.
The next generation of wildfire models will not discard the hazard layer. It will connect hazard to a much richer description of the built environment. It will treat structures, nearby vegetation, and neighboring buildings as a single fuel system. It will also recognize that this system changes over time.
We have become very good at modeling the fire. The next step is to measure what the fire will find when it arrives.
Work With Us
If you underwrite or model wildfire risk in California, Colorado, or the broader western United States, we would like to put OmniFire in front of you with a retrospective property test. Give us a set of addresses, and we will return parcel-level features you can compare with what you already know.
The measurement layer behind Ground Truth
OmniGeo’s first product, OmniFire, closes the earth measurement gap for insurers in wildfire-prone areas. OmniFire turns standard imagery into parcel-level measurements of what a property is actually made of, including roof material, defensible space, and fuel moisture. It is vulnerability measured at scale, and it is live today.