

Matthew Mazerik’s house was a seven. The houses on either side were threes.
The number was a wildfire risk score assigned to his California property, and it helped determine what Matthew paid the California FAIR Plan, the state’s insurer of last resort. In a public request for help in 2025, he wrote that his premium was nearly twice his neighbors’.
He couldn’t see why. The three homes were all on the same road and, according to the information he received, appeared to share the same basic risk factors: vegetation, slope, and neighboring vegetation. Yet his house had landed four points higher.
So Matthew did what people increasingly do when an algorithm produces an answer that both costs them money and that they cannot explain: he began assembling a case against the number.
The advice he received was specific: He should measure the distance between his house and nearby vegetation, photograph the property, and compare the characteristics recorded by the insurer with conditions on the ground. He should also find out when the aerial imagery was captured and whether it reflected recent defensible-space work. To challenge the score, he needed hard evidence.
This does not mean the FAIR Plan’s score was wrong. The public record does not tell us how the appeal ended. It does, however, reveal something more useful about risk scores: the number was meant to simplify the property for risk assessment, but the moment anyone questioned it, they had to return to the features.
A number with no units
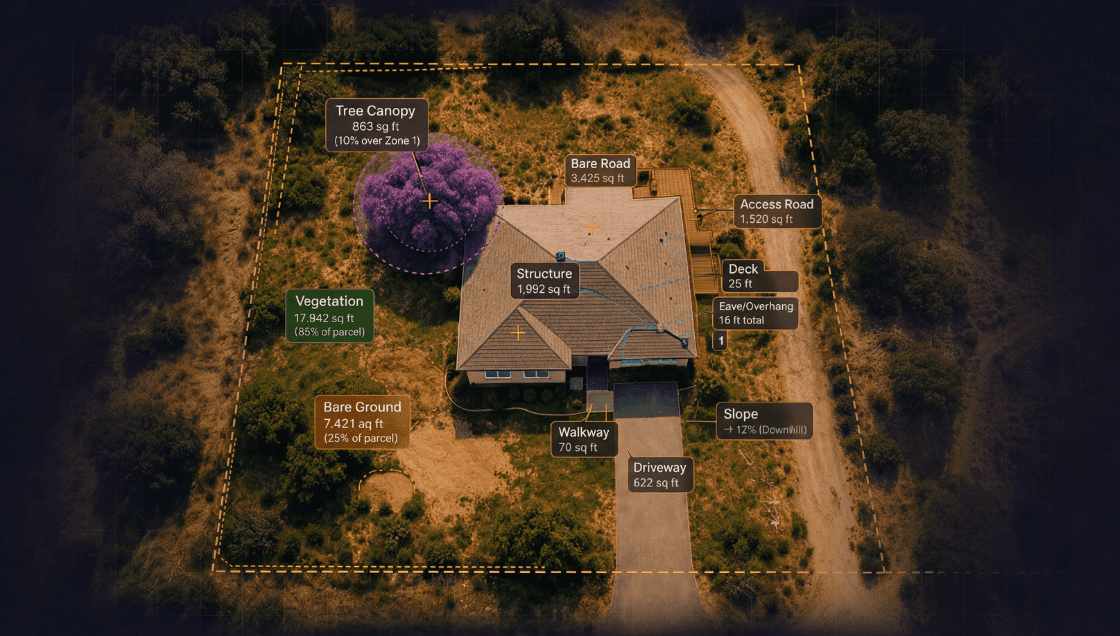
A feature is an observation: the roof is metal, a tree canopy overhangs the structure, vegetation begins three feet from the exterior wall, or a vent has a particular mesh size. Each feature can be defined, dated, checked, and compared with loss experience.
A score is a conclusion produced by combining observations with assumptions, weights, thresholds, interactions, and an intended use case. A score of seven might be perfectly predictive, or it might reflect stale imagery, a mistaken structure match, or a condition corrected six months ago. The number alone cannot tell you which, and how reliable it is.
That distinction is important because purchasing a score does not free the insurer from responsibility for the decisions made with it.
Actuarial standards directly support this point. For example, ASOP 56 applies even when an actuary uses a model developed by someone else and is responsible for its output. It asks the actuary to understand the model’s purpose, operation, dependencies, sensitivities, strengths, and limitations, while also establishing expectations for testing, validation, governance, and controls. A black box score may belong to the vendor, but the resulting decision belongs to the carrier.
ASOP 23 creates a similar obligation around data. Actuaries are expected to understand the data they use, review it for reasonableness and consistency, identify material limitations, and disclose unresolved concerns. That work is easier when a field has a definition, source, observation date, and known uncertainty. “Combustible roof covering, observed May 2026” gives an actuary something specific to test. “Wildfire score: 73” gives the actuary another model to dissect and govern, which can be challenging in practice.
AI-generated features still require scrutiny. A roof classification can be wrong, a tree may be assigned to the wrong parcel, and performance may vary because of image resolution, shadows, seasonality, or geography. With a feature, however, the questions are narrower and more answerable: Is the roof classification accurate? Is the vegetation measurement current? Where does performance degrade?
With a composite score, the carrier must answer those questions and then determine how errors interact, how the components are weighted, and whether the vendor’s definition of risk matches the carrier’s portfolio, coverage, claims, and appetite.
Regulators are requesting feature-level pricing
In 2020, California state regulators heard testimony from consumers across more than 38 counties, many of whom did not know insurers had assigned wildfire scores to their properties. They had no way to see those scores and no formal right to appeal if the underlying information was inaccurate.
The rules that followed didn’t ban scores but instead required insurers to disclose them, explain the factors that influenced them, and create an appeal process. The state also required rate filings to recognize specific property and community mitigation measures, including roof upgrades, defensible space, and Firewise participation.
As any underwriter or actuary operating in the state knows, California now requires a separate discount or credit for each mandatory mitigation factor, which means an insurer cannot simply claim that a safer roof is reflected somewhere inside an overall wildfire score. The rating plan must show how the individual action affects the premium. Utah is now moving in the same direction: its new, statewide program will assess vegetation and construction features at individual homes, then use those observations to guide mitigation and determine future risk-based fees.
That requirement creates operational necessities. A homeowner completes the work, someone verifies it, and the carrier maps it to a defined variable. An actuary then estimates its relationship to loss, the insurer files the methodology, and, if the homeowner appeals, the carrier needs evidence that the recorded condition is correct.
Features carry use case flexibility
Property features can be examined against a carrier’s own claims rather than accepted solely on the strength of a vendor’s development dataset. Actuaries can study missingness, test stability, examine interactions, and decide where each variable belongs.
Roof material might support a mitigation credit in one state, an underwriting rule in another, and a catastrophe-model adjustment elsewhere. The observation remains the same, while its weight and use can vary by geography, peril, coverage, and portfolio.
Recent wildfire research shows why this flexibility matters. A 2025 study led by researchers at UC Berkeley examined more than 9,000 structures exposed to wildfire and found that roof construction, vents, siding, defensible space, and separation from other structures all contributed to survival. Those effects also interacted. The researchers estimated that combining home hardening with defensible space could reduce expected structure loss by 52 percent under the conditions modeled. Physical wildfire risk emerged as a system of measurable conditions rather than a single fact.
A universal vendor score embeds one view of that system. Features allow an insurer to form its own view, test it against its own experience, and revise it as the evidence changes.
Reinsurers price what they cannot see
The same logic extends beyond primary underwriting and into capital.
A joint Casualty Actuarial Society and Institute and Faculty of Actuaries study found a persistent gap between the exposure information reinsurers wanted and what cedents supplied. Missing detail forced reinsurers to make assumptions and limited their ability to refine pricing. Those assumptions eventually impact the price.
The weakest data often concerns the property characteristics that modify vulnerability. In Aon’s 2025 catastrophe risk survey, respondents rated the quality of secondary-modifier data at just 2.41 out of five, below both geocoding and exposure values. The industry has become much better at locating a building than describing what will happen to it.
Features travel well through this system because a cedent can report the share of a portfolio with combustible roofs, vegetation inside Zone 0, canopy overhang, or unknown mitigation status. A broker can summarize those conditions, and a reinsurer can map them to its own vulnerability assumptions or catastrophe model. This is especially true if features are consistently defined across the industry, which is something the industry should keep an eye on.
An average proprietary wildfire score of 62 has little meaning outside the system that produced it. By contrast, “Twenty-eight percent of insured structures have combustible roof coverings” remains intelligible across models and organizations. Every opaque layer gives the next party another reason to add an assumption, which degrades modeling outputs.
The right place for a score
None of this makes scores useless. Carriers have to compress decision-making: underwriters need triage, automated systems need routing rules, and portfolio managers need a fast view of concentrations. Smaller carriers may also reasonably depend on a vendor’s model rather than build one themselves.
Scores work best as the output of a system the insurer understands and controls. They become harder to defend when purchased as a conclusion without an inspectable foundation.
The best geo AI solutions will give insurers the most accurate, transparent, and defensible view of property conditions, leaving each carrier to determine how those measurements should shape its scores and decisions. That starts with features that have precise definitions, observation dates, explicit unknown states, and traceability to source imagery, supported by performance that can be measured across geography and time.
This is the role OmniGeo is building toward: a measurement layer for the physical conditions that shape property risk, including roof material, vegetation by defensible-space zone, tree proximity, canopy overhang, and vegetation moisture. The carrier can then decide how those measurements affect underwriting, pricing, filings, and capital for their business practices and book of business.
Matthew Mazerik didn’t set out to expose an issue with models and scores. He simply wanted to know why his house was a seven when the houses beside it were threes. But the answer lay with measurements, imagery dates, and observable conditions.
Scores will remain part of insurance because they are compact and useful. As a decision moves closer to premium, regulation, or capital, however, the facts underneath it become more valuable. The durable data layers will give insurers those facts and let their actuaries decide what the final number means.
Work With Us
If you underwrite or model wildfire risk in California, Colorado, or the broader western United States, we would like to put OmniFire in front of you with a retrospective property test: give us a set of addresses, and we will return parcel-level signals you can compare against what you already know. Let us show you what OmniFire sees at www.omnigeo.ai/omnifire.
The measurement layer behind Ground Truth
OmniGeo’s first product, OmniFire, closes the earth measurement gap for insurers in wildfire-prone areas. OmniFire turns standard imagery into parcel-level measurements of what a property is actually made of, including roof material, defensible space, and fuel moisture. It’s vulnerability measured at scale and it’s live today. If you underwrite, price, or manage wildfire risk, visit www.omnigeo.ai/omnifire to learn more.